The convolution is the function that is obtained from a two-function account, each one gives him the interpretation he wants. In this post we will see an example of the case of continuous convolution and an example of the analog case or discrete convolution.
Example of convolution in the continuous case
The continuous case requires integrals to perform the convolution and the formula of the convolution of the continuous case is:
\displaystyle y(t) = x(t)*h(t) \equiv \int_{-\infty}^{\infty}x(\tau)h(t - \tau) d\tau
But do not be scared, let’s see it simple with an example.
Let’s see the following signals with which we will work in the convolution:
x(t) = \left [u(t + 1) - u(t - 1) \right ] t
h(t) = \left[ u(t + 2) - u(t) \right ]
We want to find the following convolution:
y(t) = x(t)*h(t)
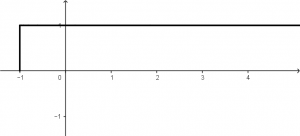
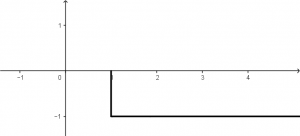
The two signals will be graphed to have a better visualization with what we are going to work with. We will graph the two signals step by step, we will start with the signal of x(t) with the inside of the brackets. The graph of u(t + 1) is a step function, which means that the graph will look like this:
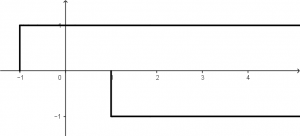
After visualizing how each signal would be seen separately, we will proceed to place them together in the same graph:
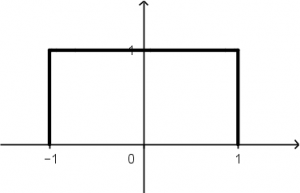
Then, the function u(t + 1) will be added (or subtracted, as you understand) to the function of -u(t - 1), resulting in the following signal:
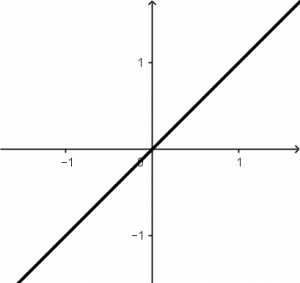
Remember that the signal will be multiplied by t, which graph of t is the following:
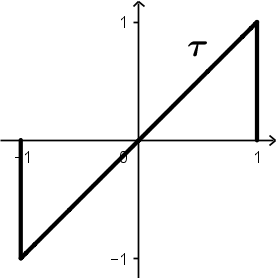
The multiplication of the function u(t + 1) - u(t - 1) by t will result in the following signal:
This is the signal that is NOT going to be moved, it is the one that will change all its t for \tau because the graph of the signal is t with slope 1, so from now on the signal it will be \tau.
We already have the first graphical signal!
We just need to graph the second signal, let’s see its function:
h(t) = \left[ u(t + 2) - u(t) \right ]
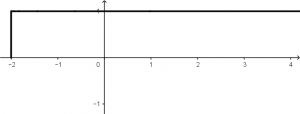
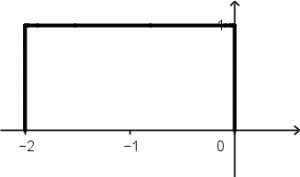
The step function u(t + 2) will have a graph that will be observed as follows:
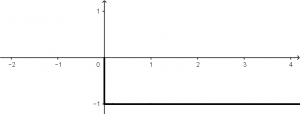
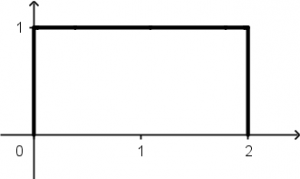
And the step function -u(t) will have a graph like the following:
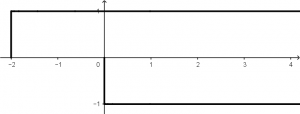
We will combine the two step functions to visualize them in the same graph:
Then, when joining the step function u(t + 2) with the step function -u(t), we will obtain the following signal:
Let’s convolute!
What we want to do is the convolution y(t)=x(t)*h(t), then the second signal is the one to make the adjustments, what does that mean? That the second signal is the one that is going to be inverted and is the one that is going to change the variable.
First let’s turn it, it would look like this:
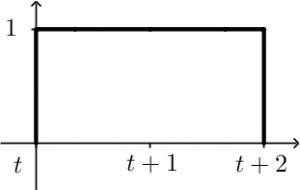
Now, x=0 will be considered t, x=1 will be considered t+1 and x=2 will be considered t+2, let’s see it more graphic:
The time has come to do the convolution calculations!
Let’s place the signal \left[u(t+2)-u(t)\right] when t<-3:
There is no case to make any integral because in all that moment when t<-3 the result will always give zero.
Now let’s analyze the case when the signal \left[u(t+2)-u(t)\right] is entering the signal \left[u(t+1)-u(t-1)\right] t, it will look like this:
The limits of the convolution integrals are always from the part where the two signals are interacting. To our integral of convolution we can not place limits of t to -1 because it is clear that there is a part where the signals do not interact, therefore, the limits of our integral of convolution would have to go from -1 to t+2, those limits will remain at -3\le t<-1 and as we already know … what will be integrated will be the product of the two signals:
\displaystyle -3 \le t < -1 \qquad y(t) = \int_{-1}^{t + 2}(1)(\tau) \ d \tau
Let’s solve the integral:
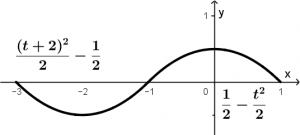
\displaystyle y(t) = \int_{-1}^{t + 2}(1)(\tau) \ d \tau = \int_{-1}^{t + 2}\tau \ d \tau = \left. \cfrac{\tau^{2}}{2}\right |_{-1}^{t + 2} = \underline{\underline{\cfrac{(t + 2)^{2}}{2} - \cfrac{1}{2}}}
The following convolution integral is going to be performed from the moment in which the point t of \left[u(t+2)-u(t)\right] has already passed to -1 of the signal \tau. Graphically it will look like this:
As already mentioned, in our limits of integration they must go in the moments in which the two signals interact. That means that the limits of our next integral would go from t to 1, this happens when -1\le t\le 1, let’s see:
\displaystyle -1 \le t < 1 \qquad y(t) = \int_{t}^{1}(\tau)(1) \ d\tau
Let’s solve the integral:
\displaystyle y(t) = \int_{t}^{1}(\tau)(1) \ d\tau = \int_{t}^{1}\tau\ d\tau = \left. \cfrac{\tau^{2}}{2}\right|_{t}^{1} = \underline{\underline{\cfrac{1}{2} - \cfrac{t^{2}}{2}}}
Now … when t>1 any integral that we do will result in 0 because the signals are not interacting.. Why are not they interacting? Because the signal \left[u(t+2)-u(t)\right] has already left the signal \tau, note:
As a final step, we will graph the convolution. This is done taking the result obtained in the integrals:
Done, that would be the convolution of the two signals!
Convolution in the discrete or analogous case
The discrete convolution is very similar to the continuous case, it is even much simpler! You only have to do multiplication sums, in a moment we see it, first let’s see the formula to calculate the convolution in the discrete or analogous case:
\displaystyle y[n] = x[n] * h[n] = \sum_{k = -\infty}^{\infty}x[k]h[n - k]
For the example of the convolution of the discrete case, we will use the following signals:
x[n] = \left ( u[n + 2] - u[n - 3] \right )\left ( 1 - n \right )
h[n] = u[n + 4] - u[n - 5]
We want to find the following convolution:
y[n] = x[n] * h[n]
First we will plot the signal x[n]=\left(u[n+2]-u[n-3]\right) \left(1-n \right). Let’s go in parts, the graph of the step function u[n+2] will start at x=-2 to infinity with a pulse of height 1:
The graph of the step function -u[n-3] will start at x=3 to infinity:
We join the two functions in the same graph and it will be observed in the following way:
As it was observed, when the two functions make contact in x=3, they will have to add (or subtract, as you understand). Then, when the pulse of one is of height 1 and that of the other signal is -1, the operation will be: 1-1=0. That means that in x=3 to infinity, the value of the sum of the two signals will be equal to zero. What will result in the following signal:
Recall that the signal was multiplied by (1-n), which (1-n) looks like this:
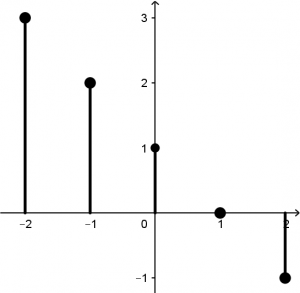
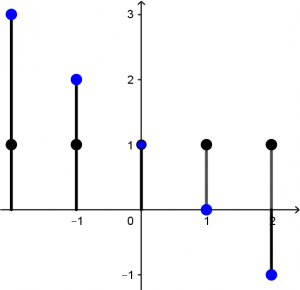
Then our signal \left(u[n+2]-u[n-3]\right) will be multiplied by each height of the line (1-n). That means that 3 will be multiplied by 1, 2 will be multiplied by 1, 1 will be multiplied by 1, 0 will be multiplied by 1 and -1 will be multiplied by 1:
Then our final signal will be:
Now graph the signal h[n]=u[n+4]-u[n-5]. We start with the graph of u[n+4], which will begin to graph in x=-4 to infinity:
Now the graph of -u[n-5], which will begin to graph x=5 to infinity:
Putting together the two graphs, they will be visualized in the following way:
What you have to do is add (or subtract, as you understand) the graphs, which will be as follows:
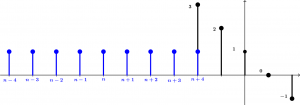
 Now we have to invert the second signal with respect to the y axis, which the signal will look exactly the same and in addition we have to change the numbers of the signal positions by n, let’s see it more clearly:
Now we can start to convolve!
In the discrete case there are no integrals, you just have to multiply and add, that’s how simple it is.
First let’s analyze the case when the two signals have not been found, that means when n<-6:
 What can be observed is that the signals have not been found, what does that mean? That at the moment the result that we are going to obtain is equal to zero, so:
\text{when } n < -6 \qquad y[n] = 0
Now, when n=-6 the result will be y[n]=3, let’s see the graph:
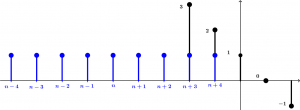
At the moment when the signal u[n+4]-u[n-5] enters the signal \left(u[n+2]-u[n-3]\right)\left(1-n\right) starts multiplying. Therefore, when the n+4 pulse of the signal h[n] touches the height pulse 3 of the signal x[n], it will multiply: 1\cdot 3 = 3. Let’s continue…
When n=-5, the result will be y[n]=5 because at that moment two pulses are having contact, let’s see:
So the pulse of n+4 will be multiplied by the pulse of height 2 and the pulse of n+3 will be multiplied by the pulse of height 3 and then the multiplications will be added:
(1\cdot 3) + (1 \cdot 2) = 3 + 2 = 5
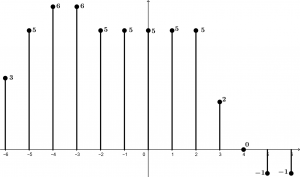
And so on, we are going to move the h[n] signal until it has traveled the entire signal x[n]. Let’s see all the operations:
\begin{array}{l c l c l c c}
n < -6 & = & & & & & 0 \\
n = -6 & = & (3 \cdot 1) & = & 3 & = & 3 \\
n = -5 & = & (3 \cdot 1) + (2 \cdot 1) & = & 3 + 2 & = & 5 \\
n = -4 & = & (3 \cdot 1) + (2 \cdot 1) + (1\cdot 1) & = & 3 + 2 + 1 & = & 6 \\
n = -3 & = & (3 \cdot 1) + (2 \cdot 1) + (1\cdot 1) + (0 \cdot 1) & = & 3 + 2 + 1 + 0 & = & 6 \\
n = -2 & = & (3 \cdot 1) + (2 \cdot 1) + (1\cdot 1) + (0 \cdot 1) + (-1 \cdot 1) & = & 3 + 2 + 1 + 0 \ - 1 & = & 5 \\
n = -1 & = & (3 \cdot 1) + (2 \cdot 1) + (1\cdot 1) + (0 \cdot 1) + (-1 \cdot 1) & = & 3 + 2 + 1 + 0 \ - 1 & = & 5 \\
n = 0 & = & (3 \cdot 1) + (2 \cdot 1) + (1\cdot 1) + (0 \cdot 1) + (-1 \cdot 1) & = & 3 + 2 + 1 + 0 \ - 1 & = & 5 \\
n = 1 & = & (3 \cdot 1) + (2 \cdot 1) + (1\cdot 1) + (0 \cdot 1) + (-1 \cdot 1) & = & 3 + 2 + 1 + 0 \ - 1 & = & 5 \\
n = 2 & = & (3 \cdot 1) + (2 \cdot 1) + (1\cdot 1) + (0 \cdot 1) + (-1 \cdot 1) & = & 3 + 2 + 1 + 0 \ - 1 & = & 5 \\
n = 3 & = & (2 \cdot 1) + (1\cdot 1) + (0 \cdot 1) + (-1 \cdot 1) & = & 2 + 1 + 0 \ - 1 & = & 2 \\
n = 4 & = & (1\cdot 1) + (0 \cdot 1) + (-1 \cdot 1) & = & 1 + 0 \ - 1 & = & 0 \\
n = 5 & = & (0 \cdot 1) + (-1 \cdot 1) & = & 0 \ - 1 & = & -1 \\
n = 6 & = & (-1 \cdot 1) & = & - 1 & = & -1 \\
n > 6 & = & & & & & 0
\end{array}
Finally, the graph of the convolution will look like this:
And that’s it!
I enclose a PDF with all the explanation of the article, enjoy it ;)
RBJLabs Convolution Continuous Analogue Case
Thank you for being at this moment with us:)

